| Tutorial >> Filters, Queues and Bandwidth |
|
Iperf is a traffic generation tool that allows the user to experiment with different TCP and UDP parameters to see how they affect network performance. Full documentation can be found at the iperf documentation page. We give an overview of some of its basic features here.
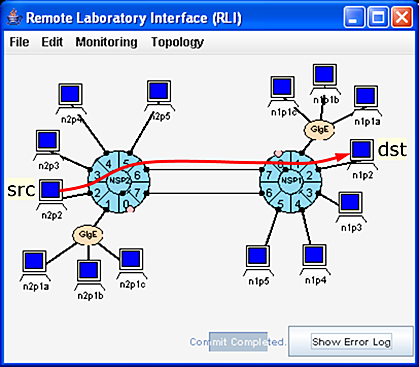
The typical way that iperf is used is to first start one iperf process running in server mode as the traffic receiver, and then start another iperf process running in client mode on another host as the traffic sender. In order to send a single UDP stream from n2p2 to n1p2 as shown in Fig. 1, we would run iperf in server mode on n1p2 and iperf in client mode on n2p2. The iperf executable is located at /usr/local/bin/iperf on every ONL host. Since the directory /usr/local/bin by default is located in every user's PATH environment variable, you should be able to run iperf by entering the iperf command followed by any command-line arguments.
For example, to reproduce the setup shown in Fig. 1 we would enter the following:
| Window | Command | Description |
|---|---|---|
| Window 1 | source /users/onl/.topology | Define environment variables such as $n1p2
Use /users/onl/.topology.csh if using a C-shell. (See The /users/onl/.topology File ) |
| |
ssh $n1p2 | ssh to the iperf server host |
| |
iperf -s -u | Run iperf as a UDP server:
( -s ) Run as server ( -u ) UDP |
| Window 2 | source /users/onl/.topology | Define host environment variables |
| |
ssh $n2p2$ | ssh to the client host |
| |
iperf -c n1p2 -u -b 200m -t 30 | Run iperf as a UDP client:
( -c n1p2 ) Run as client with server on n1p2 ( -u ) UDP ( -b 200m ) 200 Mbps bandwidth ( -t 30 ) For 30 seconds |
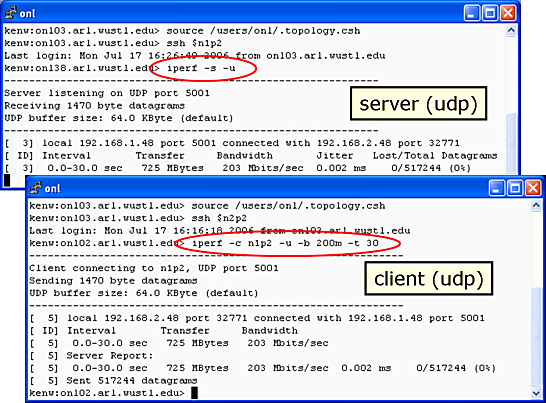
Fig. 2 shows the resulting ssh windows. In the server window (in back), the server reports that it is listening on UDP port 5001, will receive 1470 byte datagrams and uses the default 64 KByte UDP buffer. In the client window (in front), the client reports that it is connecting to UDP port 5001 and is using the same parameters as the server. It also shows that in the 30 second interval, it transfered 725 MBytes at an average rate of 203 Mb/s. This output is followed by the Server Report that shows the same statistics along with some additional ones. The fifth field "0.002 ms" is the jitter. The next field "0/517244" indicates that 517244 datagrams were sent and 0 were received out of order which results in a 0% datagram error.
At the end of a UDP traffic session, the iperf client sends out a special application layer FIN packet signalling the end of transmission. The server responds to the FIN with a reply containing the statistics for the session. The client will continue to send this FIN packet every 250 milliseconds until either the server responds with its statistics or a total of 10 FIN packets have been sent. Since the server never closes the receive socket, it is possible for the server to receive FIN packets from a preceding session thinking that they belong to a new session.
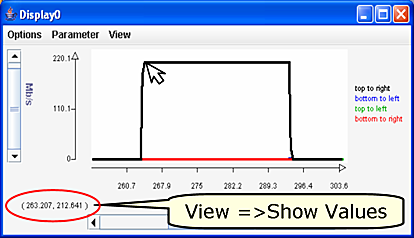
Fig. 3 shows the resulting traffic chart when the traffic flows to the right over the top link at 200 Mb/s. Notice that the measured traffic rate is over 200 Mb/s because the chosen measurement points were inside the NSP where the physical data units are ATM cells which contain an additional 10% cell header overhead. Note also that there is no measurable return traffic since the only returning traffic is the server's report datagram after the client has sent the FIN packet.
Fig. 3 shows another RLI feature: the ability to show a chart coordinate. This can be done by selecting View => Show Values".
The table below shows examples of useful variants of iperf. In UDP bandwidth specifications, "10m" represents 10 Mb/s. 'M' could also be used to signify 1,000,000. Similarly, 'K' and 'k' both indicate 1,000. The -n argument (number of bytes) in conjunction with -l (length of each datagram) is used to send a fixed number of datagrams of a specified length and is often used with small values when some forms of debugging are desired.
| iperf -h | help: Show usage information |
| iperf -s -u | Run an iperf udp server |
| iperf -c n1p3 -u -b 10m -t 10 | Run an iperf udp client with n1p3 as the server
Send at 10 Mb/s to n1p3 for 10 sec (1470-byte packets + 28 bytes of header) |
| iperf -c n1p3 -u -b 10m -l 1000 -n 8000 | Run iperf udp client with n1p3 as the server
Send at 10 Mb/s to n1p3. Send a total of 8000 bytes, 1000 bytes per pkt |
| iperf -s -w 16m | Run iperf TCP server with a 16 MB receive window |
| iperf -c n1p3 -t 10 | Run an iperf TCP client with n1p3 as ther server for 10 sec |
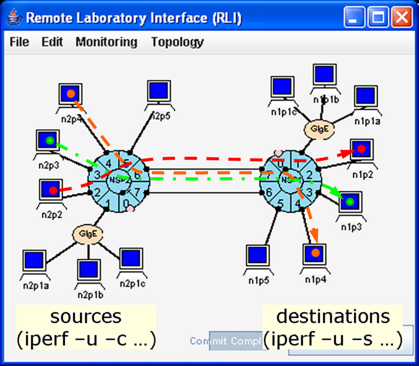
We can produce coordinated UDP streams by writing two shell scripts: one launches multiple iperf servers, and the other launches the corresponding iperf clients. For example, the following Bourne shell script run-uservers will launch iperf UDP servers:
#!/bin/sh
# Usage:   run-uservers
# Example: ssh onl.arl; run-uservers
# Note:    Clients (Servers) are NSP2 (NSP1) hosts
#
source /users/onl/.topology	# define env vars $n1p2, ...
ssh $n1p2 /usr/local/bin/iperf -s -u &
ssh $n1p3 /usr/local/bin/iperf -s -u &
ssh $n1p4 /usr/local/bin/iperf -s -u &
After the iperf servers have been started, the clients can be started with another script. For example, the following Bourne shell script run-uservers will launch iperf UDP clients:
#!/bin/sh
# Usage:   run-uclients
# Example: run-uclients
# Note:    Clients (Servers) are NSP2 (NSP1) hosts
#
source /users/onl/.topology	# define env vars $n2p2, ...
ssh $n2p2 /usr/local/bin/iperf -c n1p2 -u -b 250m -t 30 &
sleep 6
ssh $n2p3 /usr/local/bin/iperf -c n1p3 -u -b 250m -t 30 &
sleep 6
ssh $n2p4 /usr/local/bin/iperf -c n1p4 -u -b 250m -t 30 &
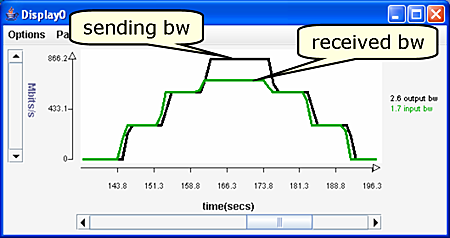
Fig. 5 shows the resulting traffic chart. The 2.6 output bw line shows the total traffic from n2p1-n2p3 going to the right over the top link out of port 2.6. The 1.7 input bw line shows the total traffic going through port 1.7. In the middle part of the plot, we can see that the total traffic going out of port 2.6 is around 850 Mb/s, but the total traffic going into port 1.7 is only about 680 Mb/s. That is because the capacity of the 2.6-1.7 link is only 600 Mb/s, the default link rate. Note again that both traffic rates in this figure have the ATM overhead of about 10%.
Revised: Wed, Sep 2, 2009
| Tutorial >> Filters, Queues and Bandwidth |
|