| Tutorial >> The Remote Laboratory Interface |
|
This section describes some features that allow the user to customize monitoring displays. These include view zooming, adding a new window, and changing plot labels.
By default, a monitoring window updates the rightmost x-axis value as new parameter values are computed, and the focus remains on the most recent set of values. So, the focus appears to move rightward as new data is included in the set of observed values. But past parameter values can be viewed by moving the x-axis slider to the left. The focus will be frozen in the selected region of interest until you move the x-axis slider to another region. Moving the slider back to the far right will return to displaying the most recent set of values.
You may want to zoom in on a portion of display to expose more detail. Fig. 1 shows three common adjustments in the ping traffic example:
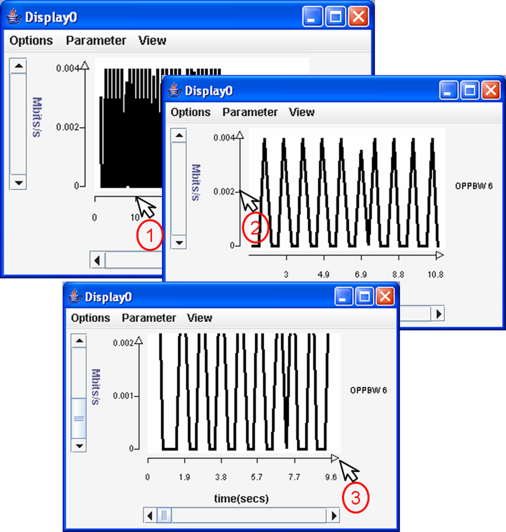
Note that when zooming, the x-axis slider moves to the left and the display freezes. In order to see the latest values displayed and continuously updated (but at the new magnification), move the x-axis slider to the far right.
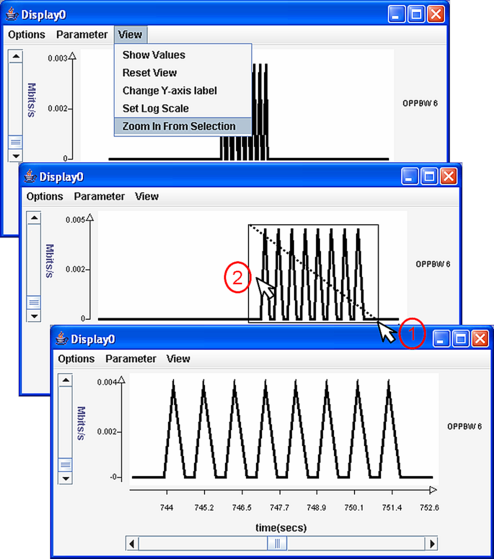
You can also do combined x-y zooming over any subregion:
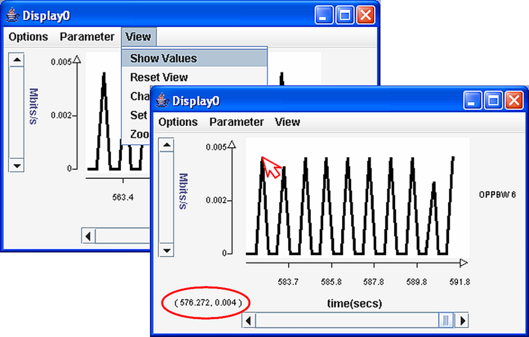
The View => Show Values menu item toggles the displaying of coordinate values of grid points selected by a mouse click. In Fig. 3, the coordinate (576.272, 0.004) is shown in the lower left corner of the top display and is the x-y value of the cursor position.
You can change various properties of a plot through the dialogue box associated with each plot label.
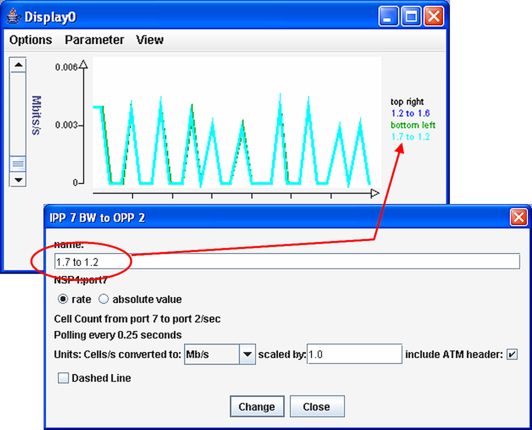
Fig. 4 shows the ping traffic display with new plot labels. For example, the new label top right was originally OPPBW 6. Here is the recipe for changing the label for the last plot from IPP 7 BW to OPP 2 to 1.7 to 1.2:
Notice that the dialogue box also tells us that each value is a rate based on cell counts collected at port 7 going to port 2 every 0.25 second. Changing from rate to absolute value will display the cell counts C(i). The values can also be scaled through the scaled by field and the Units field. Notice also that the user can exclude the ATM header by unchecking the include ATM header box.
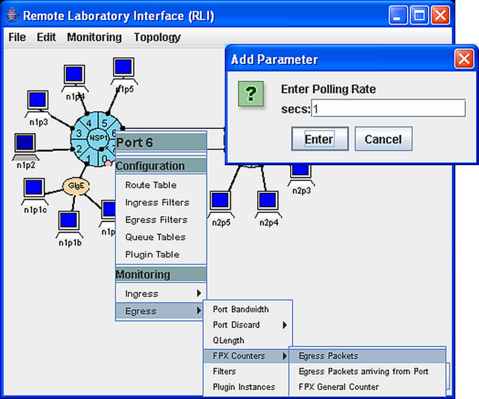
The next two figures illustrate the difference between selecting between a rate and absolute value measurement when we monitor a packet counter. Here we monitor the FPX egress packet counter at port 1.6. By default, the absolute value is displayed, but we change to a rate display.
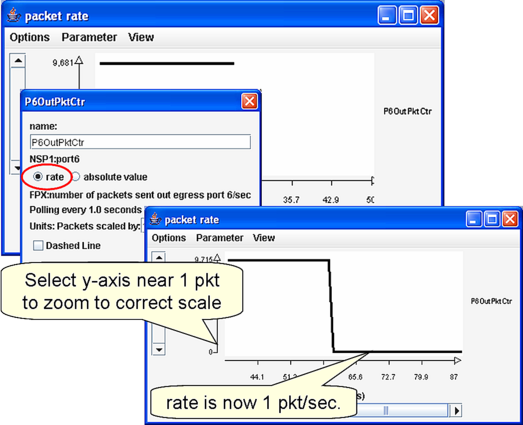
Notice that the rear display shows a y-axis value of 9,681 packets, but the front display shows that the packet count has increased by 34 packets to a value of 9,715. After changing to a rate measurement, the plot drops down to 1 pkt/sec.
Selecting the Monitoring => Add Monitor Display menu item creates a new monitoring window and makes it the new focus for adding monitored parameters.
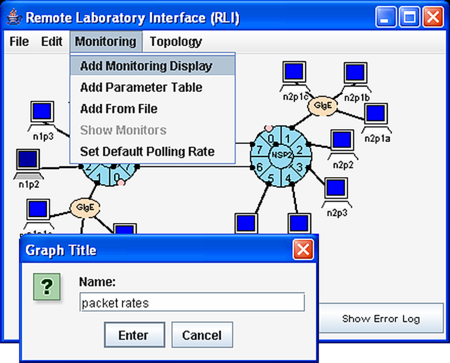
A Graph Title dialogue box appears allowing the user to enter the display title. This title can be changed at any time through the Options => Change Title menu item in the monitoring display.
If you want to add a parameter to a different display, you must return to that other display and select Parameter => Add Parameter to make it the focus of new parameters. New parameters are added at the end of the current list. There is no easy way to rearrange the parameter order.
Revised: Fri, July 7, 2006
| Tutorial >> The Remote Laboratory Interface |
|