| Tutorial >> Router Plugins |
|
This page describes passive monitoring when every packet is duplicated and the duplicate is passed to a plugin where it is examined, counters are updated and the packet is dropped. The user sets up periodic monitoring where the plugin is periodically queried for its counter values and these values are displayed in standard charts.
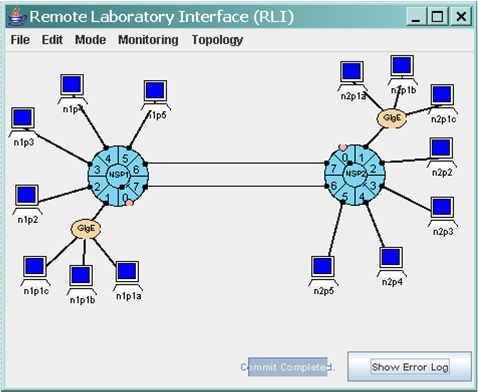
We will use the same general two-NSP setup that we have been using (Fig. 1). We will still be sending traffic through the three host pairs n1p2-n2p2, n1p3-n2p3 and n1p4-n2p4. But now, several details will be different:
The stats plugin returns three counter values when queried with a command of 1:
After the plugin sends this data to the RLI, the counters are zeroed. So, we can monitor the number of packets of each type by periodically sending the stats plugin a command of 1.
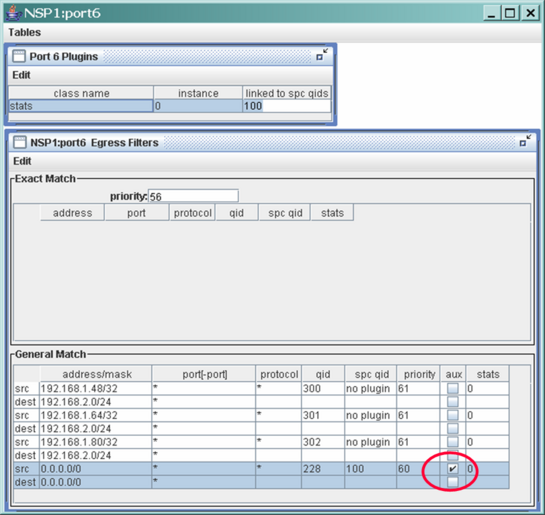
Fig. 2 shows the GM Filter and Plugin Tables at egress port 1.6. A new feature is shown in the last GM filter: the aux field has been checked. If that filter is selected, the matching packets will be duplicated and the duplicated packets will be sent to instance 0 of the stats plugin at egress port 1.6. Since every header field in the last GM filter has been wild carded (i.e., it will match every packet), and it is the highest priority GM filter with an aux field marked (there are no other aux marked GM filters), every packet passing through egress port 1.6 will be duplicated and sent to the stats plugin.
Recall from The ONL Architecture section that the lookup tables operate as follows:
So, in this example, every packet is copied and sent to the plugin, and the other packet will match one of the other GM filters and be forwarded according to the filter (i.e., it will be sent to queue 300, 301 or 302).
In Fig. 2, every table value was enterred by the user except for two:
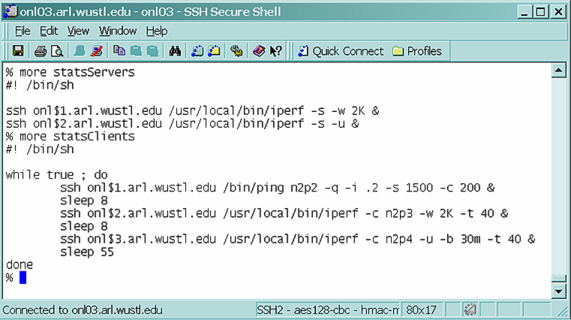
Fig. 3 shows the the two shell scripts used to generate the three test flows. The script statsServers remotely starts two iperf servers running in the background: the first is the TCP iperf server, and the second is the UDP iperf server. The command statsServers 33 34 will start the TCP server on onl33.arl.wustl.edu and the UDP server on onl34.arl.wustl.edu, both in the background. The command statsClients 43 44 45 will start sending ping (ICMP) traffic from onl43.arl.wustl.edu to n2p2, TCP traffic from onl44.arl.wustl.edu to n2p3, and UDP traffic from onl45.arl.wustl.edu to n2p4. These traffic sources are started with an 8 second stagger to make it easier to identify the start of each flow. A few more details about each flow are in order:
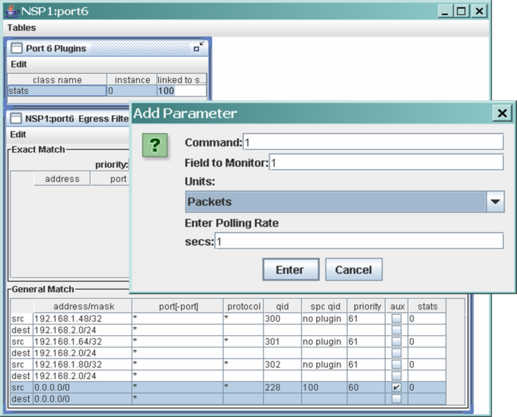
But before starting the traffic sources, we need to configure for the charting of the three protocol counters. Fig. 4 shows how to monitor the number of ICMP packets seen by the plugin since the previous query. Since the plugin returns the counts of ICMP, TCP and UDP packets in fields 1, 2 and 3 of the plugin response packet, Fig. 4 shows that the ICMP counter (field 1) is to be monitored every 1 second. The other two counters are monitored in a similar fashion except the Field to Monitor value should be 2 for the TCP packet counter, and 3 for the UDP packet counter. Here is the recipe for the ICMP packet counter:
| Window/Panel | Selection/Entry | Explanation |
|---|---|---|
| Port 6 Plugin Table | Double click stats | The Add Parameter dialogue box appears |
| Add Parameter Dialogue Box | Command: 1 | Command 1 will return counts and then zero them |
| |
Field to Monitor: 1 | The ICMP packet count is field 1 |
| |
Units Packets | Select from the menu |
| |
Enter Polling Rate secs: 1 | Get data every 1 sec. |
| |
Select Enter | A chart appears |
Repeating the above sequence but with Field to Monitor values of 2 and then 3 will add the charts for the TCP and UDP counts.
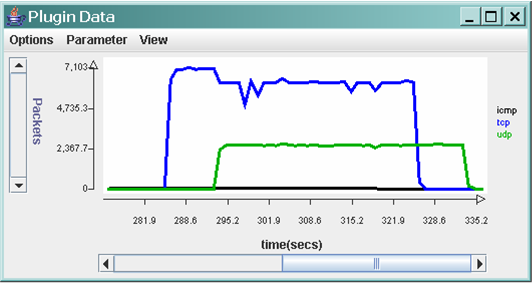
A rough calculation shows that a 30 Mbps UDP stream should generate about 2,500 1500-byte packets every second which is what the green line in Fig. 5 shows. The TCP traffic (blue line) initially peaks at about 7,100 packets per second which corresponds to about 85 Mbps for 1,500-byte packets. The ping traffic is barely visible since one 1,500-byte packet every 0.2 seconds is barely 60 Kbps. Note that in this example, since the external link rate at egress port 1.6 is 200 Mbps, and the maximum rate from FPX to SPC is only 200 Mbps, the aggregate traffic rate of the three flows (115 Mbps) to the SPC and out the external link is well under the capacity of both the external link and the FPX-SPC link.
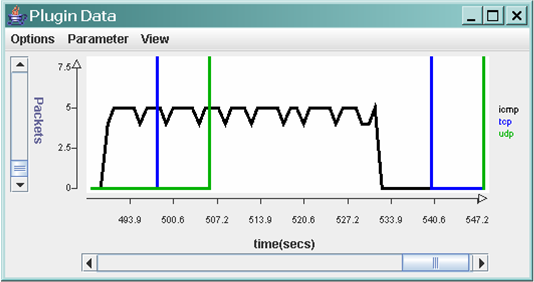
Fig. 6 shows another later run of the experiment but with the vertical axis scaled to show the ICMP traffic. As expected, the ICMP traffic chart (black line) shows 5 packets every second which is what we expect with a 0.2 second ping packet sending interval.
| Tutorial >> Router Plugins |
|