| Tutorial >> Examples |
|
The SynDemo plugin is located at ~onl/stdPlugins/syn_demo-54203. It illustrates the use of a router plugin to mitigate the effects of a SYN flood attack. It is one of the most complicated plugins and demonstrates many of the novel features of the ONL testbed:
Note 1: Remember that from outside of ONL, you will SSH to the
address onl.arl.wustl.edu which actually gives you a terminal session
on the host onlusr, the user host.
Note 2: In the insructions below, if I precede an interface
name such as n1p2 with by '$' (e.g., $n1p2), I am refering to that
host's external (control) interface, not the interface connected to an NSP.
You will not know what the actual name of the interface until an NSP
has been allocated to you.
But after the commit is done, clicking on the n1p2 icon will show
the external interface name which will be something like onl32, onl38,
onl26 or onl11.
In contrast, n1p2 is the name of the interface to the NSP.
This was explained earlier in the section
Tutorial => The Remote Laboratory Interface => RLI Basics.
Note 3: Make sure that you clean up at the end of this demo
by killing/stopping all daemons.
This page gives step-by-step instructions on setting up the demo and verifying that the different components of the demo are working properly. If you already have the prerequisite files and just want to run the demo, then go to the last section ( Putting It Together ). This last section assumes that you also have the configuration file syndemo.exp that sets up most of the monitoring displays, filters, and plugin. Here is an index to the different parts of this page:
| Preparation | |
Get prerequisite files |
| Network Setup | Configure the experimental network | |
| SSH Tunnels | Setup additional SSH tunnels (Attacker, plugin, relay host) | |
| Configuring Filters and Plugin | Load and configure plugin | |
| Monitoring Traffic | Setup monitoring of HTTP requests and image traffic | |
| Testing the Plugin | Verify that the plugin mitigates a SYN attack | |
| Partial Connections Monitoring | Setup monitoring of partial connections (plugin and HTTP server) | |
| Putting It Together | Running the demo from start to finish |
Before running the demo, you will need to copy the files shown in the table below to your home directory. It is possible to run the demo without copying any of these files to your home directory by running them out of the ~onl (/users/onl/) home directory, but if anything goes wrong, you will not be able to debug the problem since you do not have write access to the ~onl directories. The instructions given on this page assume that you will copy these files to your home directory but will use the plugin in ~onl/stdPlugins/syn_demo-54203/ and the attacker in /usr/local/bin/sec/synster.
| Component | Where to Find Files | Where to Put Files |
|---|---|---|
| Partial Connections Monitor | ~onl/bin/runTcpMon.pl | ~/bin/runTcpMon.pl |
| Web Pages and Java Classes | ~onl/.www-docs/syndemo/*.class
~onl/.www-docs/syndemo/*.html |
~/.www-docs/syndemo/ |
| Images | ~onl/.www-docs/syndemo/Images/* | ~/.www-docs/syndemo/Images/ |
runTcpMon.pl is a Perl script that extracts partial connection information from the /proc/net/tcp file of a host running the HTTP server httpd. It looks for entries with a local port number of 80 (x50) and a partial connection state (3).
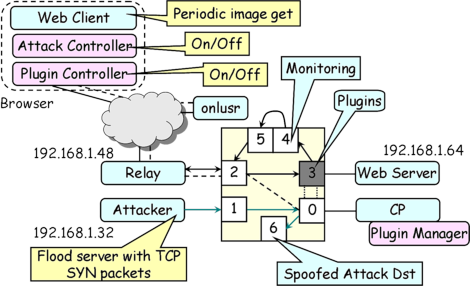
The HTML file ~/.www-docs/syndemo/index.html defines the Java applet that is our Web client. The interface contains three control panels: image transfer, SYN Attacker and plugin. When image transfers are enabled, the client sends HTTP requests that cycle through the images in ~/.www-docs/syndemo/Images/*.jpg every 3 seconds by default. The script ~/.www-docs/syndemo/Images/touchme is a script that touches each image every 2 seconds to make it appear that the images have changed thus invalidating any images that have been cached at the Web client. All of the files in ~/.www-docs/syndemo need to be world readable and any directories need to be world searchable.
These components are shown in the following diagram:
If you are only planning to run the demo, you can skip ahead to the Putting It Together section. The following sections show how to create a configuration file for the demo and discusses the various monitoring components. Network Setup
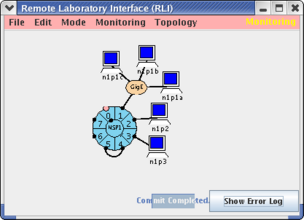
You will only need one NSP cluster and no extra hosts. But you will need to add an NSP link between NSP ports 4 and 5 for monitoring purposes. You will be constructing the setup shown below (your RLI will not show the Mode menu which has been omitted from newer RLIs).
Four (4) additional SSH tunnels must be created. This can be done by running two commands (described later). Three of these tunnels come from our Web client. The fourth tunnel is an extension of one of the first three and carries traffic between the Web server and the Relay Host. These tunnels are summarized in the table below:
| Purpose | Source Host | Source Port | Dest Host | Dest. Port | Tunneled Through | |
|---|---|---|---|---|---|---|
| A | Control synster | localhost | 5050 | $n1p1a | 5050 | onl.arl.wustl.edu + onlusr (Note *) |
| B | Control plugin | localhost | 3552 | $n1cp | 3552 | onl.arl.wustl.edu + onlusr |
| C | Client to Relay | localhost | 8080 (Note **) | $n1p2 | 8080 | onl.arl.wustl.edu + onlusr |
| D | Relay to Server | $n1p2 (Note ***) | 8080 | n1p3 | 80 | n1p3 |
Note *: When you SSH to the address onl.arl.wustl.edu
from outside of the ONL testbed, you will actually be opening a terminal
session on the host onlusr.
Note **: It is possible on some Windows systems to use port 80,
Unix systems treat ports below 1024 as priviledged ports.
Note ***:
You MUST use the -g flag in the ssh command when
building this tunnel because it is really the second part of a tunnel
that goes between your Web client and the Web server through the
experimental network.
The tunnels labeled A, B and C can be built in one step. Either issue this command from a Web client command window or use an SSH client tool to do it equivalently:
     ssh -L 5050:$n1p1a:5050	\
	 -L 3552:$n1cp:3552	\
	 -L 8080:$n1p2:8080	\
	 onl.arl.wustl.edu
Note that you must replace $n1p2, $n1p1a and $n1cp with the appropriate ONL host names (e.g., onl31.arl.wustl.edu). Note that $n1cp is the Control Processor (CP) for the NSP. Clicking in the center of the NSP icon will show you the name of the CP host. When these tunnels are built, you will be logged into the host onlusr.
Tunnel D must be built separately. The easiest way to do this is to use the above window to SSH into $n1p2 and then build the D tunnel from $n1p2 to n1p3:
     onlusr> source /users/onl/.topology.csh	# .topology if using bash
     onlusr> ssh $n1p2
     $n1p2> ssh -g -L 8080:n1p3:80 n1p3
     n1p3>
Repeat: The -g flag is important.
You will likely get a security complaint ("REMOTE HOST IDENTIFICATION
HAS CHANGED!") from the system about n1p3.
This complaint can be avoided by removing the file ~/.ssh/known_hosts.
The complaint arises because n1p3 is a logical name that won't always
have the same IP address.
Alternatively, the system may also prompt you for your password.
We start the HTTP server, and direct our Web browser at the SYN demo Web page:
onlusr> ssh $n1p3sudo will prompt you for your password.
$n1p3> sudo httpd-start
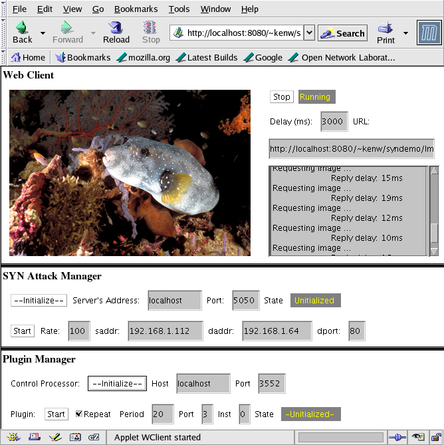
You should now see a Web page like the one shown below containing three Java applets running in three panels.
You should see a slide show where the image changes every three seconds.
We need to create two General Match (GM) filters at port 3. The ingress filter (shown below) is used to forward the image traffic from the Web server to NSP port 4 when the plugin is running so that the valid image traffic can be observed. This traffic will loop back to NSP port 5, then to n1p2 (the relay node) and then back to the Web client. When the plugin is not running, any image traffic that makes it out of the Web server will take a direct path through port 3 to port 2 where the relay node is attached.
Ingress Filter
| |
Address/Mask | Port | Protocol | Fwd to VOQ | SPC qid |
|---|---|---|---|---|---|
| Src | 192.168.1.64/32 | * | TCP | 4 | No Plugin |
| Dst | 192.168.1.48/32 | * | |
|
|
The egress filter is used to direct HTTP requests going toward the Web server to go through our plugin first. The plugin records connection attempts (SYN packets) and will send an RST packet to the Web server to drop any partial connections that have timed out.
Egress Filter
| |
Address/Mask | Port | Protocol | qid | SPC qid |
|---|---|---|---|---|---|
| Src | 0.0.0.0/0 | * | TCP | 136 | 8 |
| Dst | 0.0.0.0/0 | * | |
|
|
Install these filters and initialize the plugin by enterring the following:
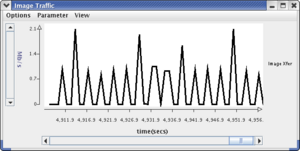
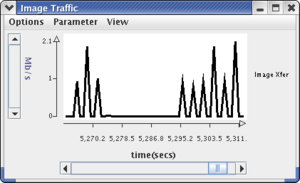
We create two monitor displays: Image Traffic and Bandwidth Traffic. The Image Traffic panel displays the traffic going out of port 4 which will be from images that are coming from the Web server and destined for our Web browser via $n1p2 (the relay node). The Bandwidth panel displays the Attacker traffic and the Valid Request traffic coming from ports 2 and 1 respectively and going to the Web server at port 3. Here is the recipe:
The following figure shows the two windows (Note: There is no interference in the image traffic because the plugin is in the Running state and before the attack traffic was started.):
Now we can verify that the plugin is working by running the attacker and plugin together while the slide show is running. The typical test situation is to have the plugin toggle between the running and stopped states every 20 seconds. The Image Transfer panel should show image traffic through port 4 when the plugin is running but mostly no traffic when it is stopped. Each successful image transfer should appear as a 0.7-1 Mbps spike every 3 seconds. A running Attacker sends spoofed SYN packets by default at 100 per second. Here is the recipe:
It will ask you for your password, and then run until you terminate it with ctrl-c. The attacker is now ready to receiver commands, but you will not see any output until you use the Web browser to connect to it.
Server's Address (localhost), Port (5050), Rate (100), saddr (192.168.1.112), daddr (191.168.1.64), dport (80). The Attacker will generate spoofed SYN packets at a rate of 100 per second with a source address of 192.168.1.112 and a random source port number.
See: A message appears in synster's window.
See: After a few seconds, the slide show should stop because the attacker has used up all of the Web server's partial connection entries. Since the table is full, the Web server can no longer accept valid requests.
See: The plugin will toggle between Running and Stopped every 20 seconds if the Repeat box is checked (which it is by default).
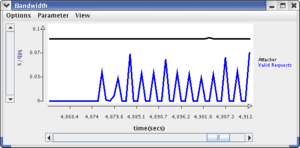
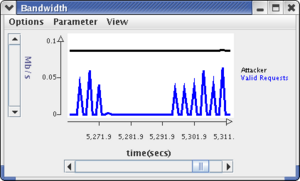
See: The slide show should "freeze" for alternating periods of approximately 20 seconds because of the SYN flood when the plugin is Stopped. The log messages in the Web Client panel should show a large delay (thousands of milliseconds) when the plugin is Stopped. The Bandwidth and the Image Traffic displays should be similar to the ones shown below. The Attacker bandwidth should show continuous traffic of about 0.08 Mbps. When the plugin is in the Running state, the Valid Request bandwidth should show about 0.04 Mbps spikes every 3 seconds, and the Image Xfer plot should show spikes of 0.7-1 Mbps.
The attacker will be sending spoofed SYN packets at a constant rate (100 per second). The Valid Requests and image traffic plots will show transmissions every 3 seconds whenever the plugin is enabled but none when it is disabled.
There is one more monitoring display: the number of partial connections seen by the Web server and the plugin. The RLI has a facility for directly getting the plugin data but not for the Web server data. However, the RLI has the concept of user data where it plots the contents of a file. We will run the runTcpMon.pl script to generate the Web server's view of the number of partial connections and use the RLI to display it.
Here is the recipe:
onlusr> ssh $n1p3 /users/YourUserName/bin/runTcpMon.pl &
This command will generate the file tcp.data in your home directory and will contain the number of partial connections made to port 80 (the HTTP port). A new value will be generated once every second.
| Field Name | Server |
| File Name | /users/YourUserName/tcp.data |
| Field Number | 0 |
| Units | Other |
Note: Do NOT overwrite your syndemo.exp configuration file by saving the current configuration because this last display depends on both the plugin monitoring and user data monitoring to be working properly.
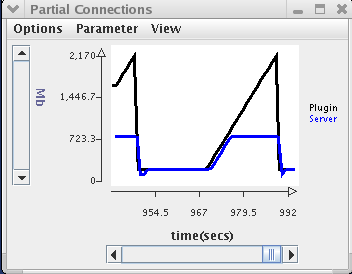
The Partial Connections window shown below indicates that the number of partial connections at the Web server ($n1p3) is about 200 when the plugin is enabled. When the plugin is disabled, the number of partial connections ramps up over 6 seconds to its peak of around 800 (200 below the server's maximum allowable backlog). When the plugin is enabled, it sends out RESET packets for all partial connections that are older than 2 seconds, thus clearing out the Web server's queue of invalid partial connections. Meanwhile the plugin has been tracking invalid partial connections when it is disabled.
This section describes how to run the SYN demonstration. It assumes that you have all of the necessary files described in the Preparations section. You will also need the configuration file. Use either the one you generated by following the earlier instructions or the predefined ~onl/export/Examples/syndemo/syndemo.exp configuration file.
What follows are two approaches to running this example. Approach 1 is suitable when running on a client that cannot or does not take advantage of Unix shell scripting (e.g., standard Windows XP, Unix without scripts). Approach 2 is identical to Approach 1 except that much of the work is done by shell scripts. This approach has the affect of reducing the chance for entry errors and reduces the number of windows. It can be simplified further by running an SSH agent on the client.
We use 6 command windows:
	client> ssh -L 5050:$n1p1a:5050	\
		  -L 3552:$n1cp:3552	\
		  -L 8080:$n1p2:8080	\
		  onl.arl.wustl.edu
	onlusr> source /users/onl/.topology.csh	# .topology if using bash
	onlusr> ssh $n1p2
	$n1p2> ssh -g -L 8080:n1p3:80 n1p3
	onlusr> source /users/onl/.topology.csh	# .topology if using bash
	onlusr> ssh $n1p3
	$n1p3> sudo httpd-start		# will prompt for your password
	$n1p3> (cd .www-docs/syndemo/Images; touchme &)
	$n1p3> ~/bin/runTcpMon.pl &	# appends to the file tcp.data
	onlusr> source /users/onl/.topology.csh	# .topology if using bash
	onlusr> ssh $n1p1a
	$n1p1a> sudo /usr/local/bin/sec/synster
Follow the earlier instructions on how to add the Partial Connections display. We add this display as a final step because it is the most likely to cause problems.
Note: Do NOT overwrite your syndemo.exp configuration file by saving the current configuration because this last display depends on both the plugin monitoring and user data monitoring to be working properly. But if you do get this part working, you can save just this monitoring display configuration to a separate file (e.g., syndemo-conn.mon) by selecting Options => Save to File in the Partial Connections window.
The demo should now be running and look like the figure shown below:
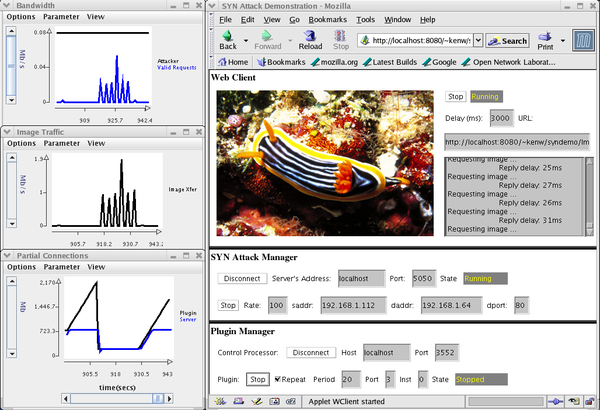
The first monitoring panel shows the Attacker traffic and the HTTP request traffic. The second panel shows the images sent by the HTTP server to port 4 (and out to port 5). In both displays, almost no request traffic or image traffic occurs during the 20 seconds that the plugin has been disabled. The third panel shows the number of partial connections (SYN attack packets) seen by the plugin and queued at the HTTP server. When the plugin is enabled, a partial connection (SYN packet only) is torn down if the SYN-ACK response has not been detected in 2 seconds. Since the attack intensity is 200 SYN packets per second, there is a background of 200 partial connections at the HTTP server. The plugin queues up partial connections even while the plugin is disabled. Since the plugin is disabled for 20 seconds, the plugin will queue approximately 2,000 partial connections during this period.
This approach only works if you can use Unix shell scripts on your client. It uses the following files from the directory ~onl/export/Examples/syndemo/:
| File | Where to Put File | Description |
|---|---|---|
| syn-tunnels.source | Client: | Define syn-tunnels alias (makes tunnels A-C) |
| syn-relay.source | onlusr:~ | Define syn-relay alias (makes tunnel D) |
| syndemo-start.sh | onlusr:bin/ | Script to start demo processes |
| mk-topology.sh | onlusr:bin/ | Script to make topology.sh script |
| mk-topology.csh | onlusr:bin/ | Script to make topology.csh script |
Remember: You can NOT push the files syn-tunnels.source and syndemo-start.sh out from the ONL testbed to your client because of our firewall rules. You must PULL them from your client (e.g., "scp onl.arl.wustl.edu:../onl/export/Examples/syndemo/syn-tunnels.source .").
This is what we do:
Two monitoring displays will appear (Bandwidth and Image Traffic).
	client> source syn-tunnels.source	# build syn-tunnels alias
	client> syn-tunnels			# build A-B-C tunnels
	onlusr> source /users/onl/.topology.csh	# if using bash, use .topology
	onlusr> ssh $n1p2
	$n1p2> source syn-relay.source		# build syn-relay alias
	$n1p2> syn-relay			# build D tunnel
	n1p3>
The script syn-tunnels.source runs mk-topology.csh on onlusr to build the file topology.source. Then, it copies the file to the client and sources it to populate the client environment with definitions of $n1cp, $n1p1a, $n1p2 and $n1p3 and define the alias syn-tunnels. Running syn-tunnels actually builds the A-B-C tunnels and leaves us logged into onlusr. The syn-relay alias builds the D tunnel from onlusr to $n1p2.
onlusr> ~/bin/syndemo-start.sh
The script prompts twice to see if you want to continue with the script. Enter y to the prompts.
	onlusr>  source /users/onl/.topology.csh	# .topology if using bash
	onlusr>  ssh $n1p1a
	$n1p1a>  sudo /usr/local/bin/sec/synster
This step could be included as the last step of the syndemo-start.sh script, but we have separated it out into a separate step to make attack daemon messages visible.
The demo should now be running and look like the figure shown at the end of the Approach 1 except without the Partial Connections display.
Follow the earlier instructions on how to add the Partial Connections display. We add this display as a final step because it is the most likely to cause problems.
Note: Do NOT overwrite your syndemo.exp configuration file by saving the current configuration because this last display depends on both the plugin monitoring and user data monitoring to be working properly. But if you do get this part working, you can save just this monitoring display configuration to a separate file (e.g., syndemo-conn.mon) by selecting Options => Save to File in the Partial Connections window.
The demo should now be running and look like the figure shown at the end of the Approach 1.
Revised: Thu, Jan 4, 2007
| Tutorial >> Examples |
|