| Tutorial >> Writing Your First Plugin |
|
Because the mycounter plugin is very simple, you will probably not encounter bugs. But in a more complicated application, a successful compilation does not mean that you won't encounter problems. Here are a few typical bugs that even a seasoned plugin programmer may encounter:
Plugins run in the OS kernel of the SPC. In some sense then, debugging a plugin resembles debugging code inside an OS kernel: there is limited debugging support and it is easy to trigger errors with seamingly catastrophic results. In the most severe cases, the SPC will lock up and there will be no indication of the problem. But because the plugin environment (described earlier) limits the points of interaction with the kernel, the types of errors are also limited. In fact, most errors will occur in either the handle_packet or handle_message routines.
Here are some useful tips:
You can get plugin output displayed using the MSR_DEBUG macro which is a printf-like facility. This is a summary of what you need to do to use this facility (details are provided later on this page):
Look at the file ~onl/stdPlugins/COUNTER-200/COUNTER-debug.c and you will see the following code for the COUNTER_handle_packet routine (I have deleted the comments):
    void
    COUNTER_handle_packet(struct rp_instance *this, void *bufferList) {
      struct COUNTER_instance *inst = (struct COUNTER_instance *)this;
      inst->pkt_count++;
      MSR_DEBUG( (MSR_DEBUG_PLUGIN | MSR_DEBUG_LEVEL_INFO,
              "COUNTER_handle_packet: Instance ID = %d got pkt %d\n",
    		            this->instanceid, inst->pkt_count) );
    }
If you use the standard supplied Makefile, you can compile the code to output debug messages by entering:
    make clean
    make debug
gcc -DMSR -D_KERNEL -DMSR_PLUGIN -D_LKM -DMSRDEBUG ... remainder of command
Now, we must get the output saved in the file /tmp/debug.log on the control processor so that you can view the output. As shown in Fig. 1, you can pop up a debug dialogue box by selecting an NSP icon and then the debug item. Note also, that the CP is also shown in the menu (onl12.arl.wustl.edu in the figure).
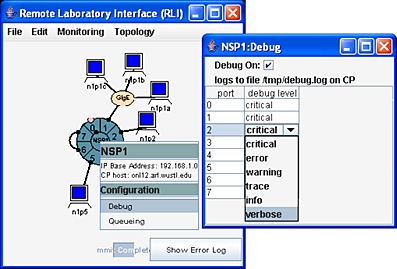
In order to get MSR_DEBUG output to show up in the debug log file, you must do the following:
What is really happening behind the scenes? When you select Debug On, the RLI starts a monmsgs process running on the CP. monmsgs captures debug messages coming from the SPCs that are managed by that CP. When you select a debug level for a port, the RLI sends a message to the SPC on that port telling it that debug messages at that debug level (or higher) should be sent to the CP over a special VCI.
You can choose to view the debug output interactively or after the fact. In either case, you will be displaying the contents of the file /tmp/debug.log on the CP host. This typically means that you will use one of the following commands: cat, more, tail or a text editor (e.g., vi, emacs). For example, suppose that onl12 is the CP host. We could do the following to display the /tmp/debug.log file:
    remote> ssh onl.arl.wustl.edu
    onlusr> ssh onl12
    onl12>  cd /tmp
    onl12>  tail -f debug.log
Alternatively, we could run the following command from our client if we have defined $n1cp (e.g., as an environment variable):
ssh onl.arl.wustl.edu "ssh $n1cp tail -f /tmp/debug.log"
Note that debug output from all of the selected ports will appear in the file /tmp/debug.log. If you want to show only the output from a particular port, you will have to run something like the grep command or some other filter command to select the lines of interest.
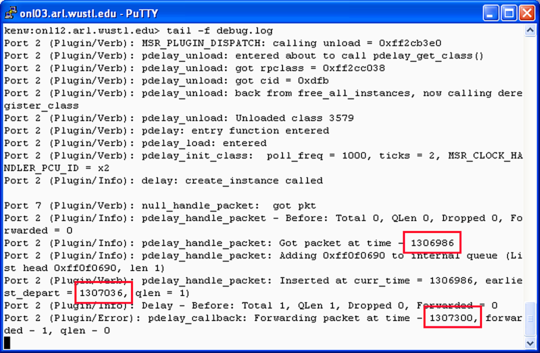
Fig. 2 shows an example of the debug.logpdelay_handle_packet at time 1306986 (in milliseconds since reboot) and was scheduled to depart 50 msec later at time 1307036.
But you might be wondering why the actual time that the packet was forwarded was at time 1307300 or 314 msec after its arrival rather than the scheduled 50 msec delay (the default delay of the pdelay plugin). The ping packet would have also reported an RTT of about 500 msec rather than 50 msec. The extra delay was caused by the debug output itself! You can expect every line of output to cause a delay of about 50 or 60 msec of delay. If you look at the pdelay plugin code, you will see that interrupts are disabled why pdelay_handle_packet is running. This means that even the hard clock interrupt that normally executes every 0.5 msec can not run until control is returned from the pdelay_handle_packet routine. The normal callback period for the pdelay plugin is 1 msec. But since it depends on the hard clock interrupt routine to be called, it too doesn't get called until control has returned from the pdelay_handle_packet routine. Recompiling the plugins without debugging enabled would show that the delay is indeed 50 msec.
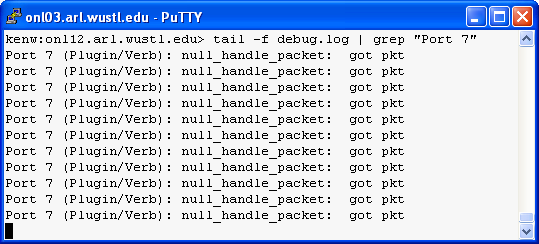
Fig. 3 shows the output when we send 10 ping packets and use the grep command to select only the messages coming from port 7.
Revised: Tue, Nov 27, 2007
| Tutorial >> Writing Your First Plugin |
|