| Tutorial >> The Remote Laboratory Interface |
|
The RLI is a standalone Java application that allows a remote user to interactively configure an experiment and monitor a variety of measurement points within the testbed infrastructure. This page describes the basic features of the RLI including resource acquisition, routing table configuration and traffic monitoring. A recipe (an example without much discussion) for this section can be found here.
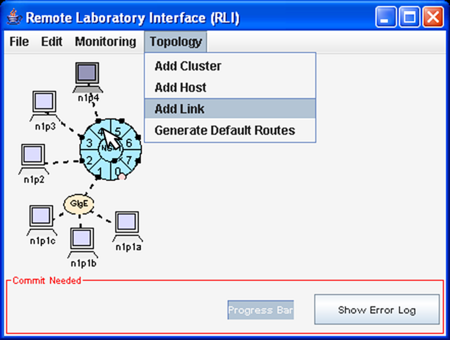
The first step in constructing an experiment is to define the network components and topology. Fig. 1 shows the main RLI panel during the configuration phase with its main drop-down menus at the top. The user has added components using the Topology menu. The links are shown as dashed lines, and the hosts and NSPs are shown in light shade indicating that the components have not yet been bound to actual testbed resources. A cluster consists of an NSP, with its CP, two directly connected hosts and a gigabit Ethernet subnet with three more hosts. Additional hosts can be added and linked to other ports by selecting Topology => Add Host and Topology => Add Link. The Generate Default Routes item in the Topology menu initializes each of the NSPs' eight routing tables (one for each input port) so that packets sent to any host will be routed to it along some minimum hop path.
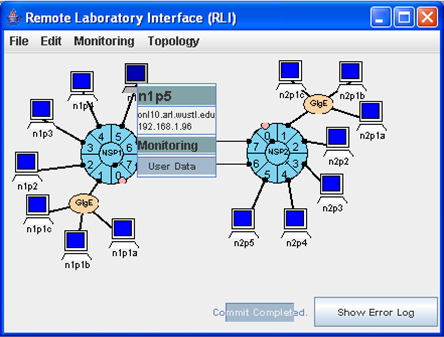
To allocate and initialize physical resources in the testbed, the user selects File => Commit. Assuming the requested resources are available, the RLI display will be adjusted as shown in Fig. 2. Note that the links are now shown as solid lines and the components are displayed in a darker color. This signals that the components are now bound to actual hardware resources. The names and IP addresses of each host can be determined by selecting the host with the left mouse button. As shown in Fig. 2, each host has two names, an internal name (n1p5 in the example) and an external name visible from within the testbed (onl10.arl.wustl.edu). These two names really correspond to the two interfaces on each host.
The internal name n1p5 corresponds to the IP address 192.168.1.96 shown in the RLI display and is the address assigned to the host interface that carries your data traffic between testbed hosts. These addresses only meaningful with the context of your experiment, and like the internal names are assigned algorithmically, making it possible to repeat an experiment in different sessions without having to modify names and addresses used in demonstration scripts. The external host name onl10.arl.wustl.edu is name of the external interface and is attached to the ONL control network. It is visible to any ONL user within the testbed environment, but only the user assigned to that host can access it. The external host name can be used to open an SSH connection to the host from the ONL user host for the purpose of running applications. Note that the ONL user host is the login host onl.arl.wustl.edu which is accessed via SSH from outside of the testbed.
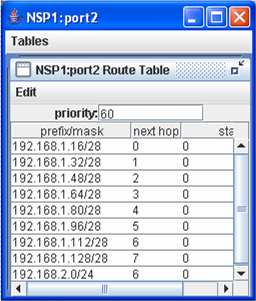
A user can change the routing table at each router's input through the RLI. Fig. 3 shows a route being added at input 2 of NSP 1. Since this prefix has a specified length of 32, it takes precedence over the less specific matching prefix with length 28. Note that each entry includes an IP address prefix with mask length, the next hop port, and a statistics field.
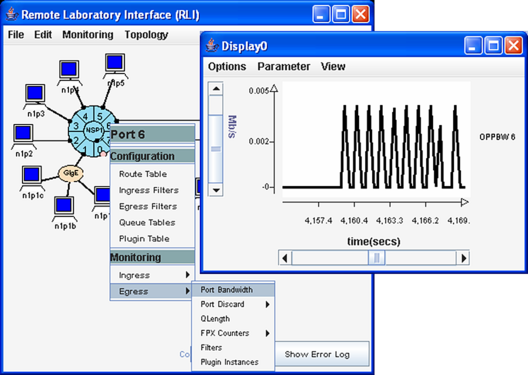
As shown in Fig. 4, the RLI can also be used to create traffic displays by selecting the desired router component to get a menu. The Monitoring part of the menu provides access to the various monitoring points within the NSPs. Fig. 4 shows a situation where the user is monitoring the ping traffic from host n1p2 to host n2p3 as it leaves port 6 of NSP 1. The user can zoom in on parts of the display, change many of the labels to suit his/her tastes, and perform a host of other display operations.
The NSPs provide mechanisms for monitoring a wide variety
of measurements, including link bandwidth, bandwidth usage
from inputs to outputs, the number of packets matching any
given route or packet filter, and the number of packets
discarded due to link overflows or header errors.
All can be connected to real-time displays, that can be
customized in a variety of ways to best suit the user's needs.
Experimental configurations can be saved to a file, making it
relatively easy to return to an experiment in a later session.
Revised: Thu, June 29, 2006
| Tutorial >> The Remote Laboratory Interface |
|